Jump To Section
The buzz about data-driven product management is something we’re very familiar with.
Long gone are the days when you could only rely on intuition — data is now everyone’s friend, and product managers have spent a considerable amount of time operating in a data-driven manner.
This has also contributed towards the rise of big data analytics tools and other product data management systems and strategies.
Having said that, while the importance of data as a product and how it is used in data product management is not lost on us, there is one big question to be answered:
Where does this data come from?
What Drives Product Data Management?
What specific data do you need to drive your product?
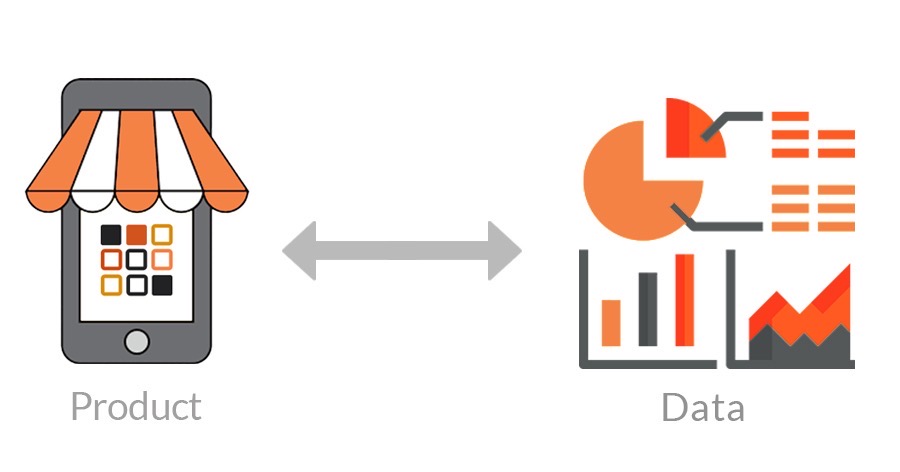
Product and data are both drivers in product management; we drive right data from the product and the same data helps product managers make the right decisions for that product.

Understanding that the relation between product and data runs two ways is the first step in product data management.
We know where data comes from and how it plays a key role for your product, but what are the most significant stages where data is the key for decision-making?
Data-Important Stages in the Product Life Cycle
Data plays a part at nearly every stage of product management.
Specifically, there are three main stages in the product management life cycle where data should be central to making key decisions for the product:
- Acquisition
- Retention
- Expansion
1. Acquisition
Acquisition is one of the first few steps in product management.
In order to achieve better acquisition for your product, it’s essential to track the right product acquisition metrics.
There are several product-driven user acquisition metrics that are useful in data management for products, but some of the most important ones you’ll need are listed below:
Customer Acquisition Cost (CAC)
We are all aware that acquiring new customers is much more expensive than keeping the ones you already have.
So, how much does it cost you to bring in a new customer? And what is a reasonable cost per new customer for your company?
Calculating client acquisition cost, a crucial parameter that enables you to enhance your marketing initiatives and increase overall sales, will help you find the answers to these concerns.
The formula to calculate this metric of customer acquisition data is as follows:
(Sales Cost + Marketing Cost) / Total new customers
Customer Lifetime Value (CLTV)
At times, a customer may stick around for a few years, buying more of your product until they no longer require it or they switch to a different business.
How much revenue will a customer generate while they remain a client?
The formula to find this metric is as follows:
Average total sale x Sales over time x Average customer lifespan
Conversion Rate
Not every visitor to your business will make a purchase.
They might look around your website or app, but they may not buy anything.
You want to make it more likely for people to buy something, sign up for your mailing list, or do anything else you want them to do.
The formula to use to gauge how many of your visitors actually convert into buyers is as follows:
Number of conversions / Total visitors
2. Retention
The first step in developing long-term consumer loyalty is typically customer retention.
Customer retention refers to the ability of a company to convert new consumers into recurring customers.
Retention is critical to the success of your product; and to achieve it, cultivating loyalty amongst your consumers will always cost less than acquiring new customers.
According to Harvard Business Review, acquiring new customers will cost your business 5 to 25 times more than retaining current customers.
Therefore, for the best chance at achieving and improving retention, the top metrics you should consider are:
Customer Retention Rate
This is the easiest metric to use to gauge customer loyalty and the volume of recurring business you are bringing in.
There are a number of additional indicators alongside customer retention rate that you can track to get a more comprehensive picture of how your product is doing.
Customer retention is calculated for a specific period of time. Depending on your specific needs, it can be calculated for weeks, months, or years.
It is usually reflected as a percentage, and the formula for calculating customer retention is as follows:
(Customers at end of defined period – Total new customers during defined period) / Customers at start of defined period * 100
Customer churn
The rate at which customers discontinue using your products or services is known as your customer churn rate.
This can typically happen when a customer decides not to renew their subscription, stops doing business with you, or ends up doing something else instead of continuing with your product.
Much like customer retention rate, customer churn is also calculated for a specific period of time, again, totally dependent on your needs.
The formula for it is as follows:
(Existing customers at start of defined period – Existing customers at end of defined period) / Existing customers at start of defined period
Net Promoter Score(NPS)
A measure of customer satisfaction called Net Promoter Score (NPS) quantifies how probable it is for customers to recommend your product to others.
This value shows how satisfied and devoted a customer is to your brand.
Although a high NPS can’t ensure customer growth and retention, it can help identify product advocates that are most likely to generate referrals.
Low customer satisfaction is reflected in a low NPS, which may suggest that some sort of intervention is required to improve things. Here’s the formula for NPS:
Percentage of Promoters – Percentage of Detractors
3. Expansion
As with any product manager, your aim will also be to keep clients loyal and coming back for more business throughout the growth stage of the customer lifecycle.
To keep your customers satisfied and engaged with you — and in turn making them a profitable customer — you would upsell, cross-sell, and offer expert services, training, and whatever else you can think of.
In an ideal world, you’d also like to see them become brand ambassadors for your product. If they are incredibly pleased with your product, they will assist in spreading the news and provide you with some priceless word-of-mouth advertising.
Expansion is majorly based on the results that you get from retention metrics.
But there are a couple of key metrics that help with the expansion phase:
Monthly Recurring Revenue (MRR)
Undoubtedly one of the most crucial levers for long-term growth is expansion revenue.
This indicator, also known as expansion monthly recurring revenue (MRR), counts the money gained from repeat business through upsells, add-ons, and cross-sells.
ProfitWell recommends that at least 30% of your revenue should come from expansion for a healthy product.
According to the Product-Led Growth Flywheel framework, expansion revenue corresponds to the user journey’s adoration stage, when your loyal customers start exploring new applications for your product.
Net Revenue Churn
Simply put, some of your customers will stop using your product.
And so, you will regrettably almost always need to disclose some churn.
When you do that, the net churn is a better indicator of your product’s health than gross churn rate, since it provides a more holistic picture.
Customer churn is generally a less effective metric for growth than revenue churn. This is because, as much as we try denying it, losing your most profitable customer hurts much more than losing your favorite one.
Owing to this, if you only use one churn figure, it should be the net revenue churn, which represents the sum of money lost after deducting any new, expanded, or reactivated revenue. The formula to calculate this is:
(Revenue lost in defined period – New & Expansion Revenue) / Revenue at the beginning of defined period
Takeaway
Data management is a huge part of product management that can be approached in multiple ways and requires a deep understanding of the what, why, and how of data, data collection, data management, and big data.
Across the entire product life cycle, and particularly at the most vital stages, product data management will define the quality of decisions made pertaining to your product.
In doing so, to avoid getting stuck in the web of massive amounts of data, it’s best to know exactly which data you need that will have the most impact on your product.
FAQs
How do you acquire customer data?
There are several ways to collect data for product data management. Direct observation of customer behavior and preferences, focus groups, surveys, interviews are all the most commonly used methods. Once the customer data is collected, there are multiple ways to assess that data; exploratory data analysis, qualitative data analysis, predictive analysis, etc. are all methods that can be used to further analyze the data.
What is the main focus of product management?
The core focus in product management is to provide the most value to the customers while also generating value for the business. It combines product vision, strategy, and a deep understanding of the target market and customers to align on a product roadmap. Product management is a function that provides direction throughout the product life cycle — from developing the product to customer acquisition, retention, and expansion.
What is the difference between qualitative and quantitative data?
Qualitative data is information that is not represented in numeric values, but rather in descriptive terms. Quantitative data, on the other hand, is quantifiable information that can be measured and represented in numeric terms. While qualitative data is more about gauging factors like customer motivation and intent, quantitative data collects vast amounts of information through questionnaires, polls, surveys, etc.
What are the three components of CLV?
The Customer Lifetime Value (CLV) measures a customer’s average revenue over the period of their relationship with a company. The three components that make up the CLV are: 1) continuous margin after deduction of costs like retention spending, 2) constant probability of retention per time period, and 3) discount rate.


