Jump To Section
To build and manage a product in the digital world today heavily relies on data and data-driven analytics.
With data guiding important decisions, there remains no doubt that data-driven decision making will continue to dominate as the modus operandi for digital businesses.
In this article, we’ll cover three techniques that will show you how to make data driven decisions.
But first, let’s understand why using data to make decisions is such an important part for successful product companies.
Why are data-driven decisions important?
While data has always been integral to any business in any form, never has it been more important to extract, collate, and analyze this data efficiently.
With massive amounts of data now generated on a daily basis, there are several reasons successful organizations play such close attention to user data analytics for data driven decisions:
1. Innovation
Companies that recognize the importance of data driven decision making don’t just look at it as a digital “trend”. They treat it as an essential asset for the business; with data guiding important decisions, digital insights are seen as an opportunity to seek more knowledge and drive a culture of innovation within the organization.
2. Competitiveness
With a higher dependency on data, you gain the ability to evolve your business in accordance to emerging trends.
Not only does this increase the adaptability of your organization to keep up with the latest patterns in the industry, but such adeptness also helps you use data to make better decisions that ensure you stay ahead of your competition.
3. Improved communication
Working with key insights and user data analytics is a great way to keep your organization aligned with important KPIs that contribute towards business growth.
By being on the same page, your organization can perform as one cohesive unit that never loses sight of what needs to be achieved and which kind of user data is needed for it.
4. Consistent growth and opportunities
One of the prime benefits to businesses that leverage user data analytics is that of consistent growth and discovering fresh new opportunities.
Being able to consistently make data-driven decisions empowers your organization to narrow down on key insights, performance metrics, and actionable benchmarks that keep you ahead of the curve by continually encouraging growth.
What is an example of a data-driven decision?
To understand how businesses have come to recognize the importance of data and user data analytics, let’s take the example of a business with a large base of millions of active users.
Netflix, a giant in the content streaming industry, leverages user data to achieve consistent customer retention.
Despite increasing competition in the industry, Netflix has found ways to prioritize the user experience by studying their behaviors, preferences, and watch patterns.
With such deep insights from user experience data analytics, the streaming service is able to recommend relevant and accurate content suggestions to each user, significantly improving their experience on the platform, which keeps customers coming back for more.
What are some key factors when making data driven decisions?
With a good understanding of all the ways user data analytics can help in your business, it’s vital to keep the following factors in mind for analytics driven decision making:
- Organize your data effectively
Format your collected data properly, before jumping into the analysis. Remove outdated information or irrelevant data that is not aligned with your goals, and get rid of duplicated data to remove confusion and arrange the data systematically.
- Overcome your biases
Keeping yourself aware of factual data will limit your bias and help you make more informed decisions that aren’t based on guesswork. It is one of the best practices in data-driven decision making to collaborate with colleagues and consider other perspectives by seeking out more conflicting information.
- Ensure data literacy
Only educating yourself on data won’t suffice; you should ensure that every stakeholder that contributes towards important business decisions is well-versed in working with data. This can be done by making your data more user-friendly and easily understandable, and also by analyzing who in your organization has the capability of working with data.
For more tips on how you can effectively manage data, read about our 3-tiered approach in this article on The What, Why, and How of Data Management In the Age of Digital.
3 Techniques To Make Data-driven Decisions
Now, let’s walk through some of the most useful techniques that are great for making data driven business decisions.
There are several other techniques to drive better decision-making with user data and decision driven analytics, but the following are found to be most effective:
- Funnel analysis
- Cohort analysis
- Event-based tracking
Funnel analysis
A funnel analysis is a technique for figuring out how many people proceed through each phase in order to reach a particular outcome on a product.
The series of phases is known as a “funnel” because the standard shape used to visualize the movement of users resembles a kitchen or garage funnel.
There are some great benefits of using a funnel analysis:
- Identify the exit pages with a significant volume of visitors
- Figure out the sources of your best visitors
- Aid in decision-making for team members and stakeholders
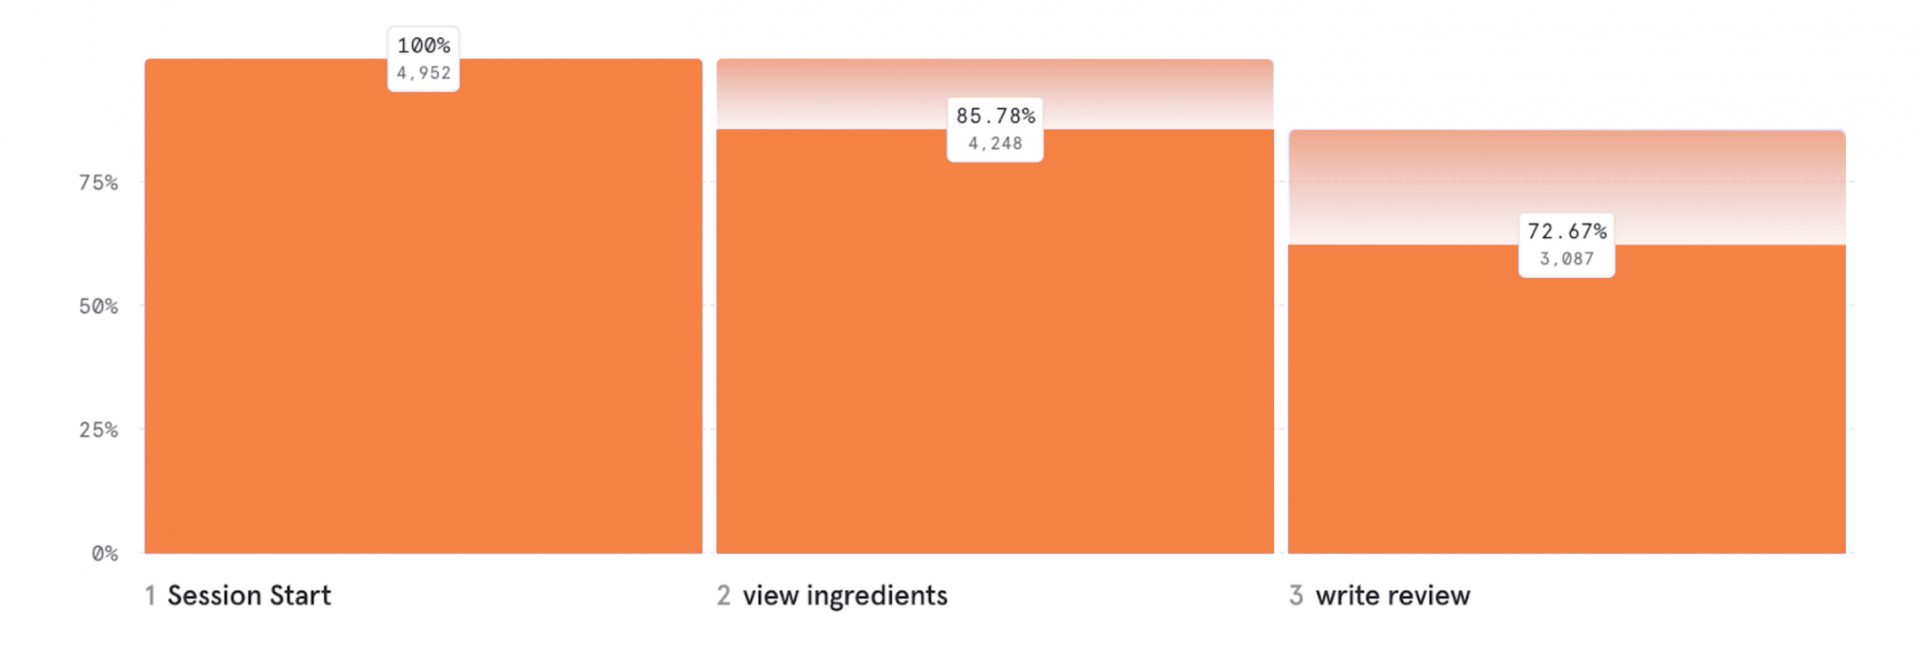
Let me share an example of a funnel analysis done where we are looking how many customers started the session on the app, then viewed the ingredients and submitted the review.

In the image above, we can see that around four people started the session and 85% of the customers viewed the ingredients.
This further dropped until the write review step, showing that there’s an overall 62% conversion rate from session start until the “write review” step.
This is how funnels help to understand the drop, on which you can further do different analyses to understand what’s causing the drop and how you can mitigate that.
Cohort analysis
How do you analyze your user base to study various types of users when not every user feels the same way about your account?
Cohorts are a means to divide up users into subsets based on a shared trait.
Let’s take the simple example of a blog website.
To begin with, imagine a scenario where every person who visited the account for the first time is compared to how they behaved the next time they visited and interacted with it.
Then, we evaluate this user behavior at two distinct times, testing for the same characteristic, which is first-time users, as you continuously push out updates, and analyze how various update types affect first-time user behavior.
Now, let’s say you published some extremely interesting material in January and February and noticed a rise in interaction.
But in March, you added some pretty awful, enormous graphics to the landing page, and noticed a decline in retention.
First-time user study is useful in such situations because it helps eliminate the prejudices of customers who have some brand loyalty and will continue to use the product despite poor UX.
The goal here is to compare behavior and responses to various activities performed using the first-time experience.
Cohorts become important in this situation.
You need to compare KPIs as you push out new features, factoring in the KPIs you are measuring first. Conversions and retention are the KPIs that individuals most frequently consider when discussing cohorts.
In other words, are your users turning into paying clients or are they only returning to your product itself? You can determine what features and KPIs are driving behavior in this way.
Event-based tracking
Let’s look at event-based tracking now.
This is the technique I would emphasize the most on because it’s the one that businesses do the least.
By examining each and every interaction a user has with your product or your screen without clicking, you can now get into the mind of the user. And using instrumentation is the only way you’ll be able to gather this data.
Instrumentation should be a consideration for your engineers when they design your product. It’s a difficult process because you’re adding a lot of instrumentation in addition to writing code and releasing a new feature.
But bear in mind: you’re not being an effective product manager if you have to do this after launch. The post-launch process is highly expensive, and you’ve already lost a lot of really important data.
Event-based tracking enables you to dissect particular elements of the user experience. How many times, for instance, was a picture loaded? How many times did the same error message appear, or how many characters were entered?
This type of analysis enables you to guarantee that your customer experience is excellent. Consider what the client is doing when you create your instrumentation and how you want to instrument it. And some of these are actually rather difficult; it’s not always simple to perform.
I collaborate with a few of our customization teams, and a lot of these initiatives involve technology hurdles you need to consider right away. Consider your technology choices before moving on with the project.
Takeaway
In this article, we explored the many ways data-driven decision making can drive incredible benefits for your business, both externally and internally.
On the external front, user data is definitely something to be leveraged if you want to remain competitive in your industry and become a giant, like in the example we saw.
Within the organization, staying on top of user data analytics will help keep your teams aligned and focused towards clear, common business goals and place benchmarks and KPIs that all contribute towards your journey to success.
If you want to learn more about data-driven product management and which stages of the product life cycle can benefit from the use of user data analytics, don’t skip this article here: Do Products Drive Data or Does Data Drive the Product?


