Jump To Section
As system management becomes increasingly complex, effective monitoring tools are more important than ever.
Enter Prometheus and Grafana – a dynamic duo for anyone concerned with system observability.
The combination of these popular tools offer a comprehensive ecosystem for monitoring, alerting, and data visualization, providing valuable insights into the health and performance of your systems.
Prometheus is an open-source monitoring and alerting system that excels at collecting and storing time-series data, while Grafana is a powerful visualization and dashboarding tool.
Together, they provide a comprehensive solution for monitoring, visualizing, and alerting on the performance and health of systems and applications.
This guide will walk you through the process of integrating these tools into your system management strategy, offering practical solutions to commonly faced challenges like data overload, lack of real-time visibility, and complex system diagnostics.
These crowd favorites form a powerhouse that can handle monitoring, alerting, and data visualization, truly serving as a lifeline to complex system management challenges.
Armed with this guide, you’ll gain the ability to detect issues swiftly and respond to them effectively, thereby enhancing the overall reliability of your systems.
What is Prometheus?
A Go-based open source monitoring programme called Prometheus gathers metrics data and saves it in a time series database. It was created by SoundCloud at the beginning in 2012, then in 2016 it joined the Cloud Native Computing Foundation (CNCF). PromQL, a potent query language, is used to query your time series data.
Prometheus is a core technology for monitoring and observability of systems, but the term “Prometheus” can be confusing because it is used in different contexts. Understanding Prometheus basics, why it’s valuable for system observability, and how users use it in practice will both help you better understand it and help you use Grafana.
Features of Prometheus
- Data Model and Query Language
- Time-Series Database
- Data Collection
- Service Discovery
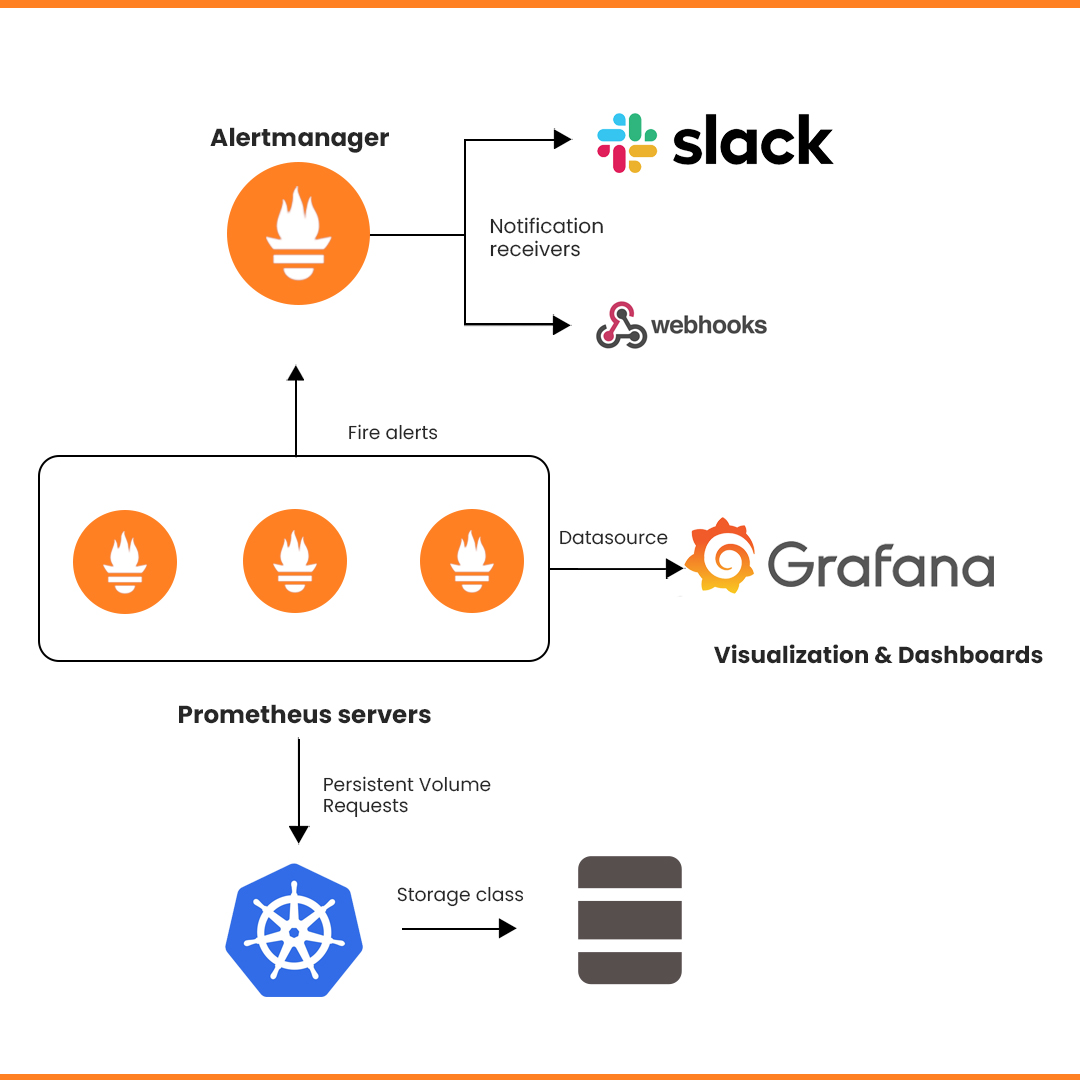
- Alerting and Notification
- Visualization and Dashboards
- Scalability and Federation
- Reliability and High Availability
- Pull and Push Models
How PromQL Helps

The functional query language known as PromQL, or Prometheus Query Language, enables you to choose and aggregate time series data. With its flexibility and strength, you can manipulate your data however you see fit.
For example, if you want to retrieve CPU usage metric from a target named “my_app”, you would use this:
cpu_usage{job=”my_app”}
What is Grafana?
Grafana is an open-source tool for executing data analytics with the aid of metrics that, when combined with scalable dashboards, provide us an understanding of the intricate infrastructure and vast amounts of data that our services handle.
Every data source imaginable, including Graphite, Prometheus, Influx DB, ElasticSearch, MySQL, PostgreSQL, etc., is connected to by Grafana.
As an alternative, we may create our own custom plugins to link with any data source of our choosing thanks to the open-source nature of the solution.
Technically known as time series analytics, the technology aids in the study, analysis, and monitoring of data over a period of time.
By providing pertinent data, it enables us to track user behavior, application behavior, the frequency of problems occurring in production, pre-production, or any other environment, the sort of faults occurring, and contextual settings.
Features of Grafana
- Dashboard Templating
- Provisioning
- Annotations
- Kiosk mode and playlists
- Custom plugins
- Alerting and alert hooks
- Permissions and multiple teams
- SQL Databases
- Monitoring your monitoring
- Authentication

Understanding the Grafana Dashboard
The dashboards draw their information from connected data sources like Graphite, Prometheus, Influx DB, ElasticSearch, MySQL, PostgreSQL, etc. These are just a few of the numerous data sources that Grafana by default supports.
The dashboards have a wide range of visualization options, including the many charts and graphs and geo maps, heat maps, histograms, and other visualizations that a business generally needs to analyze data.
On the grid of the dashboard, there are numerous separate individual panels. There are many functionalities for each panel.
Getting started with Prometheus and Grafana
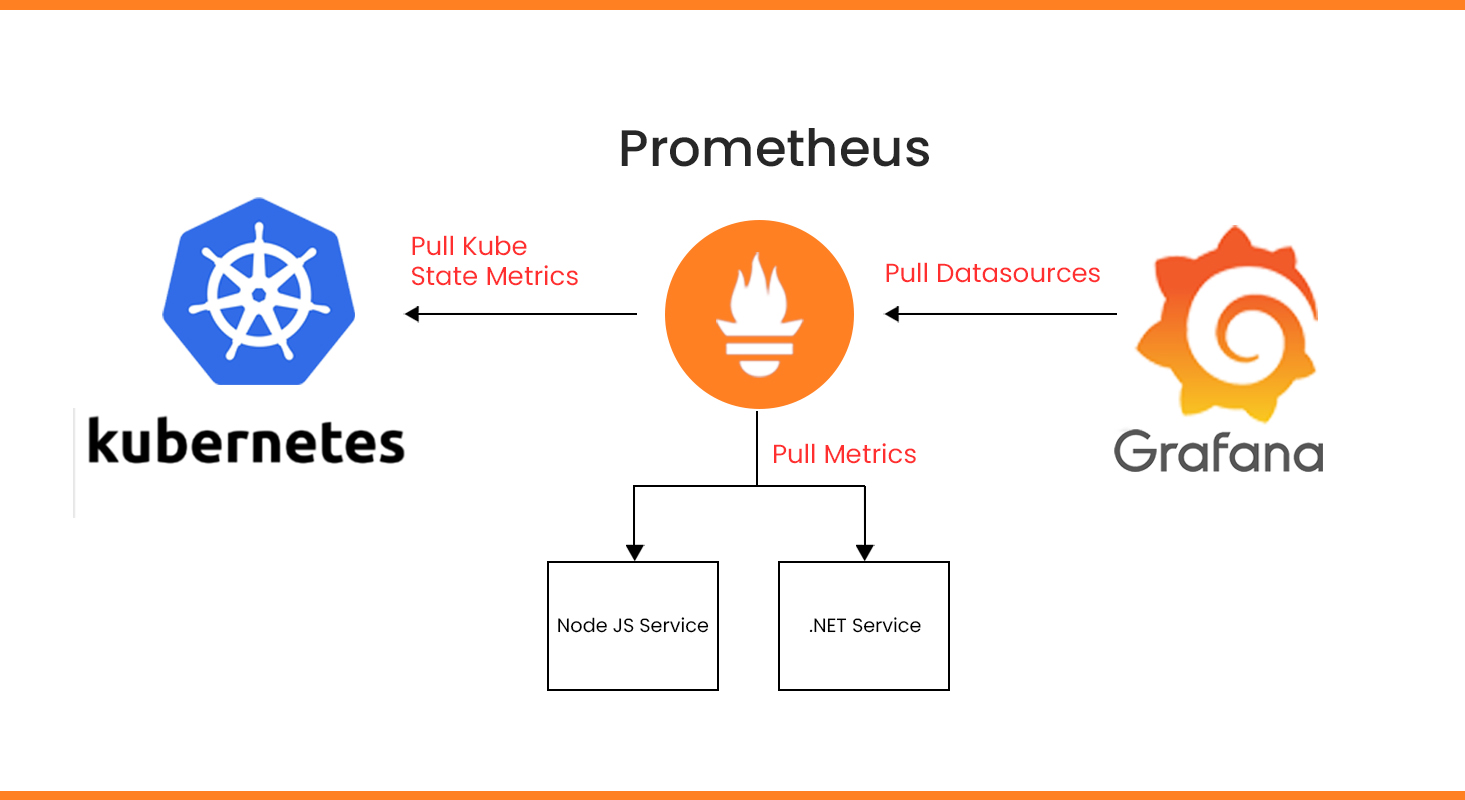
After installing Prometheus and Grafana, you need to set Prometheus as the data source in Grafana and you can do that using the following steps:
- Click on the Grafana logo to open the sidebar.
- Click on “Data Sources” in the sidebar.
- Choose “Add New”.
- Select “Prometheus” as the data source.
- Set the Prometheus server URL
- Click “Add” to test the connection and to save the new data source.
Why use Prometheus and Grafana?
There are many reasons why the combination of Prometheus and Grafana can prove to be very powerful when integrated correctly into your systems.
For starters, you have control over the metrics you want to report, their origin, and their destination when Prometheus and Grafana Agent are used together.
Once the data is in Grafana, a Grafana Mimir database can be used to store it. The combination allows you to monitor and visualize the health and performance of your systems comprehensively, making it easier to detect issues and respond to them effectively.
Takeaway
Overall, Prometheus and Grafana are popular tools that provide a robust ecosystem for monitoring, alerting, and visualization, making them valuable assets in maintaining the reliability of your systems.
The additional functionality of PromQL further enhances the value delivered by this combination, offering granular control over metrics and data.
With the ability to accurately monitor health and performance, respond to issues effectively, and visualize data in an intuitive manner, these tools become instrumental in ensuring system reliability.
Their power rests in their flexibility, scalability, and the profound insights they provide, making them a game-changer in the landscape of system administration and data analysis.


